

Mapping Color
Mapping Color
By Robert Meganck, Chair Communication Arts, VCU, Matt Wallin, Associate Professor, Communication Art, VCU and Peter Martin, Affiliate Faculty, Physics, VCU
Although color is a concern of disciplines as diverse as art, science, business and medicine and has experts in disciplines as diverse as the breakfast cereal industry and the Pentagon, it is arguably one of the most widely misunderstood yet most used visual principles. This misunderstanding stems from the fact that most people believe color is a physical property of an object rather then the perception and interpretation of visible wavelengths that emanate from or are allowed to pass through an object that has been affected by luminance. Although the ability to create and view objects in virtual space (three-dimensions) has been readily available for decades, color systems are still being presented as two-dimensional or as two-dimensional depictions of three-dimensional models.
Even those who use color most fundamentally misunderstand many of the basic principles of color theory: where and how color is generated, how it interacts with an object, how a person interprets the incoming light wavelengths to generate a perceived color, and how color impact is produced and manipulated in various media. The absence of any definitive tool that accurately define and articulate the essence of color science and color math may contribute considerably to this problem.
For years students have been taught, that the colors in the visible spectrum are red, orange, yellow, green, blue, indigo, and violet (ROYGBIV) as identified by Sir Isaac Newton in the 17th century, although anyone viewing the spectrum can easily see an infinite array of colors. Further, art students, who are exposed to more sophisticated color theory, are being taught that the primary colors (colors that cannot be mixed from other colors) are red, yellow and blue (subtractive primaries), whereas photography students are taught that the primaries are red, green and blue (additive primaries), as if these two systems are mutually exclusive. A basic problem in teaching such a subtractive system to art students, in particular, is identifying which red, which yellow and which blue are being referenced. Color identification by means of common names (red, blue, etc.) is inadequate for the identification of the spectrum of colors available to us.
In professional practice, the tools used to identify, analyze, and manipulate color are more sophisticated but still lack a level of precision and functionality that could benefit a range of fields in which color analysis is important. Currently, individuals working with pigments (graphic, interior and fashion designers, painters, etc.) are using outmoded color pickers or are relying on subjective judgments to select colors with little or no understanding of a color’s location in color space, and with little or no understanding of how the appearance of a specific color will change as a result of changes in illumination.
Color Gamut: An Interactive 3-Dimensional Color Model, aims to address this problem by creating interactive, web-based software and mobile application tools that can be used by artists, engineers, scientists, educators and students. The model will map specific colors, color space and all its complements in various formats. The project involves the development of a system to identify colors based on their hue (color), saturation/chroma (purity) and value (lightness/darkness), and to show their location in relation to all other colors using Cartesian coordinates on a 3D interactive and programmable model. To our knowledge, this will be the first interactive and programmable three-dimensional model defining color space available internationally.
Albert Munsell first proposed the concept of identifying colors by using a three dimensional component model in 1915. His model was based on a five-color system (yellow, green, blue, purple and red). Since then, a few models have been proposed that are based on the more accurate six color (YRMBCG) system but none are interactive and available for general use.. The principles of color theory can be better presented using contemporary technologies. Having the ability to navigate a color model in virtual space is key to understanding color. Currently, color is taught using textbooks written half a century ago. Color mixing is taught using subtractive primaries as a complete system. Many color theory textbooks published in the past ten years do describe a system that combines both the subtractive primaries (CMY) with the additive primaries (RGB), but remain two dimensional depictions of three dimensional space and cannot be made interactive by virtue of the traditional book format.
Current color picker systems do not take advantage of current technologies, they are primarily two dimensional, and do not take into account Value, Chroma and Hue, VCh, color location. These current color picker systems are difficult to use because colors are not located with a complete hue set (the range of the colors that belong to a single hue family, for example: the tints, shades and degree of chrome that belong to the 5 degree “red” family). Without a standardized tool developed from available technologies, any industry that requires standardized systems to identify colors functions awkwardly with antiquated tools to produce, select, and identify color. The Color Gamut Project – a collaboration between VCU artists, physicists, computer scientists, and software engineers – will quite literally revolutionize how color can be used in science, information technology, and manufacturing.
It may be easiest to describe our model as a “point cloud” or a mass of floating marbles (Figure 1). Each marble identifies the location of a specific color so that the viewers can navigate around and through the model, allowing them to not only see the location of a specific color, but also see its location in relation to all other visible colors.
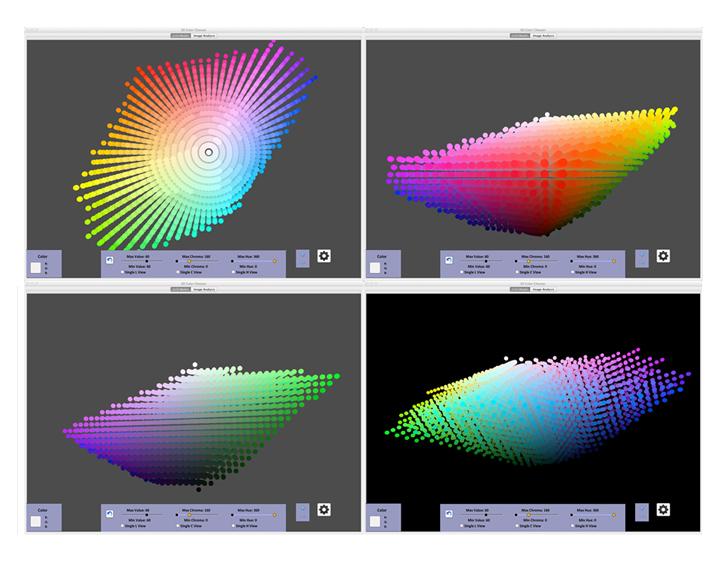
Figure 1: The Color Gamut model: top
view, side view, split vertical view and dimensional view.
The color model developed for the Color Gamut Project will identify and describe colors based upon human perception, differing substantially from the subtractive and unscientific approaches most commonly employed in education and practice. It utilizes three parameters; the color or hue or wavelength (does it seem to be red, or green or blue or any other general color term); the purity, or saturation or chroma which describes how much of the color appearance can be attributed to a unique hue (or color or wavelength); and the value or lightness, which relates a color to an equivalent achromatic scale. These parameters are the same as those available on instrumentation used to quantify the color of a sample and are commonly used in the pigment and color measuring industries for quality assurance.
In order to provide greater accuracy and specificity, we are proposing a color identification system based on a color’s location on a Cylindrical Cartesian coordinate system, which would use degrees (0 - 360) to identify hue (figure 2), a scale (0-100+) to identify chorma/saturation, and percent (0%-100%) to identify value/lightness (Figure 3). The model is based upon the CIELab or CIELuv coordinate systems that have been developed by the Commission Internationale de l’Eclairage over the last 80 years to provide a good approximation of the response of the eye to color differences.
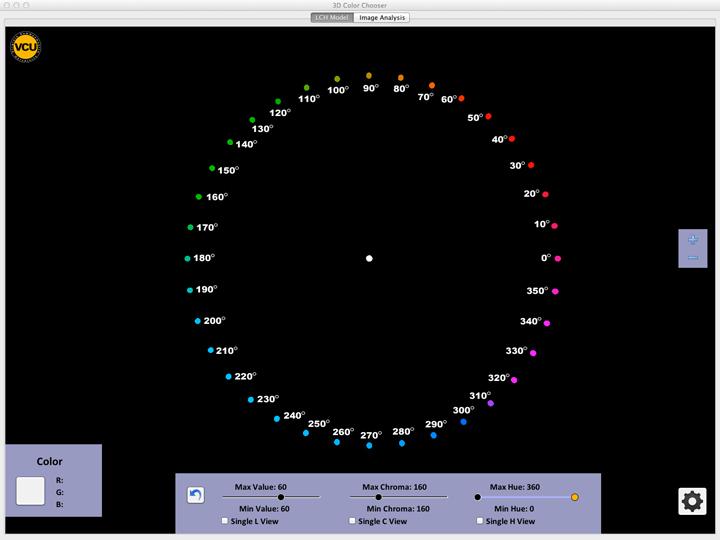 Figure 2: Using degree to identify hue, as opposed to using common names, allows for unlimited
specificity
Figure 2: Using degree to identify hue, as opposed to using common names, allows for unlimited
specificity
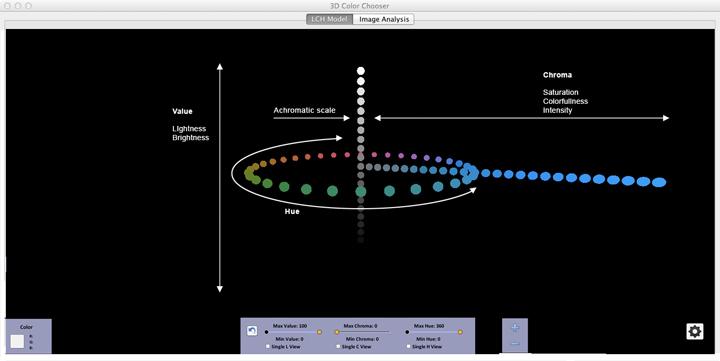 Figure 3: Diagram showing how Value, Chroma and
Hue are plotted in 3D space
Figure 3: Diagram showing how Value, Chroma and
Hue are plotted in 3D space
If, for example, you were to apply 3D color mapping to Adobe Photoshop’s current color picker, chorma would be aligned with value. It would additionally show the relative distance between full-chorma and the achromatic scale (figure 4).
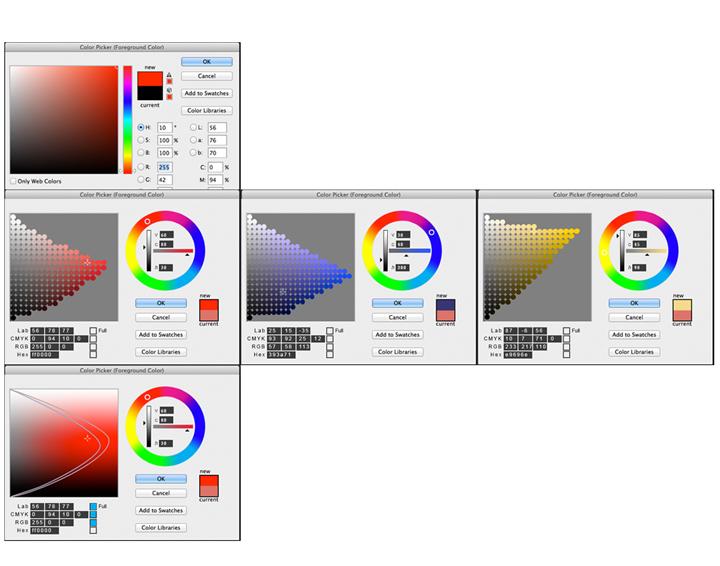 Figure
4: top: Adobe Photoshop’s current color picker; middle row: showing chroma relative to value; bottom: granular mode – showing CMYK gamut within RGB gamut
Figure
4: top: Adobe Photoshop’s current color picker; middle row: showing chroma relative to value; bottom: granular mode – showing CMYK gamut within RGB gamut
The full range of colors that a person can perceive is known as the human gamut. Any mathematical model used to display color space will most likely either use a screen (each pixel is an additive combination of red, green and blue light sources) or printed material (each point in the image is a combination of cyan, magenta, yellow and black pigments). Both of these display modes have a limited gamut, or range of colors, that can be displayed, and both can only display a fraction of the colors perceivable by humans. It is our intent to use a translucent shell to show the location of colors that are part of the human gamut but which cannot be represented colorimetrically because of the limitations of the display media gamut (figure 5).
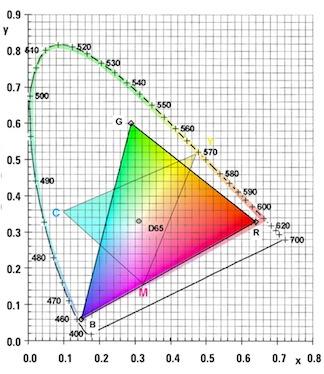
Figure 5 (right): CIE chromaticity diagram showing the RGB and CMYK gamut in relation to full human gamut.
Additional developments could include a fully interactive three-dimensional model of the visible color spectrum with a host of various controls to manipulate the model. This would allow the user to draw out and highlight various connections and relationships between colors that could generate a host of useful applications yet unimagined. In addition to the visualization of RGB gamut space, we expect the final model to include variation showing CMYK, Pantone, and artist pigment space. An interactive model would allow the user to input any pigment color, or a pallet of pigment colors and not only see individual color location, but also show all the colors that can be mixed with a pallet of colors, for example how color space changes when you substitute Cadmium Red for Alizarin Crimson. The use of commercially available image capturing devices would enable a user to do real time analysis and see how objects were changing color with time or environmental conditions.
Using the image or color description that can now be obtained with color measuring equipment the model could be used to show where sample colors are located with regard to control specifications. Color differences or color sample quality assurance can be done in a 3-dimensional space rather than relying on multiple 2-dimension charts. The model also has potential application in biology where it could detect subtle changes in the color of foliage brought on by environmental conditions, or monitoring the quality of artwork to detect gradual deterioration. It is anticipated that using hand-held image capturing devices, the model could be used to detect real time changes in color. These applications will be evaluated once the model is improved to provide histograms of colors appearing in an image and the computer code is improved to allow more efficient processing of images. Since this model is based on the mathematical identification of color rather then using perceptual differences, color specificity is not limited by the range of common color names. Using mathematical location to identify color will ultimately break down language barriers in specifying colors.
Key personnel:
Robert Meganck
Chair, Communication Arts, VCU. Robert is a Professor of illustration,
graphic design and digital imaging, and Chair of the Department of Communication Arts at Virginia Commonwealth. He has been teaching design and illustration courses for 36 years and has been teaching
Color Theory and Practice for more then 10 years. Additional information can be found at http://meganck.com/
Matthew Wallin
Associate Professor,
Communication Arts, VCU. Matt is an internationally recognized visual effects artist having created compelling visual effects for feature films and broadcast for over fifteen years. Additional
information can be found at http://mattwallin.com/
Dr. Peter Martin
Affiliate Faculty, Physics, VCUPeter’s experience has
included technology, management, education and communications. He has been successful in ap plying fundamental scientific principles to practical problems and working effectively with others to
develop solutions. In industry he has dealt with the application of color technology in quality assurance, and in academia he has seen the need to communicate the scientific basis of color to
non-science students who are well versed in using color, but have a poor understanding of the underlying principles.
References:
Albers, Josef; Interaction of Color, Yale University Press, 2009
Berns, Roy; Billmeyers and Saltzman’s Principles of Color Technology, John Wiley and Sons, 2000
Boynton, Robert and Peter Kaiser; Human Color Vision, Optical Society of America, DC, 1996
Fairchild, Mark; Color Appearance Models, John Wiley and Sons, 2005
Gurney, James; Color and Light: A guide for the Realist Painter, Andrews McMeel Publishing, 2010.
International Commission on Illumination(CIE), Proceedings of the 8th. Session, Paris 1931
Itten, Johannes; Elements of Color, Spon Press, Revised 1990
Itten, Johannes; The Art of Color: The Subjective Experience and Objective Rationale, John Wiley & Sons, Revised 1997
Munsell Color Company; Munsell Book of Color, Baltimore Md, 1929 to date.
Parramon, Jose M.; Color Theory, Watson-Guptill Publications, New York, 1989
Sharma, Abhay; Understanding Color Management, Thompson Delmar Learning, 2004
Turner, Joy; OSA OSA Instrumental in Development of the Uniform Color Scales, Optics and Photonics News, Sept. 1999
Yot, Richard; Light for Visual Artist: Understanding & Using Light in Art and Design, Laurence King Publishers, 2011
Zelanski, Paul and Fisher, Mary Pat; Color, sixth edition, Prentice Hall, 2010
In addition the following interactive web sites (physlets) provide insight as to how color is created and the interrelationship of several of the existing models used to describe colors.
http://www.highpoint.edu/~atitus/physlets/blackbody/index.htm show how the electromagnetic radiation from a black body emitter changes with the source temperature and what color it seems to be when interpreted by human vision.
http://www.omsi.info/visit/tech/colormix.cfm color generation by addition and subtraction, and shows how the final visual appearance depends on the relative intensities of the primary colors (red, blue, green for addition and cyan, magenta and yellow for subtraction).
http://www.cs.rit.edu/!ncs/color/aspectr.html show how the color appearance to the average human vision is dependent upon the spectral distribution of the incident illumination.
http://www.colorpro.com/info/tools/convert.html#START shows how a single color is represented in several color appearance models (CIE La*b*, XYZ, xyY, Hunter Lab, and RGB) and displays the color parameters associated with that color in each model.
http://www.cs.rit.edu/~ncs/color/aspaces.html shows graphic representations of the RGB, HSV, YIQ and CIELab color space models and shows a color swath of any chosen location in any of the color spaces.De Grandis, Luigina; Theory and Use of Color, Prentice-Hall, New Jersey; and Harry N. Abrams, New York, 1984